

Total immersion in the video streaming experience, that's what a user wants. Streams with interruptions, errors or poor performance disturb this experience. Viewers dissatisfied with your stream quality will complain and, eventually, leave. Perhaps never to return. Good video analytics tell you what the viewing experience is really like and inspire you to continuously improve it.
What you can’t measure, you can’t manage. This is why, when we deploy video streaming platforms, our clients usually ask us to include video analytics. Without detailed insights, they cannot get a sense of the real-world experience of their viewers. Video analytics provide these insights in real-time, so video providers know how their streams are being experienced and what they need to do to optimize that experience.
A million things can go wrong
There are a million things that can go wrong when streaming a video. The video experience a user has depends on many variables, including extremely user-specific ones like the device and the connection. External factors, such as operating system updates and other processes can also impact performance. To manage all these variables, you first need to measure them. And, although we always work platform- and vendor-independently and like to leave the choice of platform to the customer, we have had good experiences with Conviva's Experience Insights platform. This is an intelligent solution with many measurement options and useful statistics and visualizations.
Heartbeats
Conviva supports many different video players. For almost every common video platform they have an SDK available. These SDKs enable the players to send information about user behavior and technical performance at fixed intervals. These data packets, called "heartbeats", are then immediately available for analysis.
What exactly do you want to know?
What data should be in these heartbeats? That depends, of course, on the type of services you provide and what you want to achieve. Conviva provides a standard set of data, which includes the most important metrics for Quality of Service (QoS) and Quality of Experience (QoE): viewing time, dropped-out users, delayed video starts, frame rate, image quality, rebuffering rate, and so on. But the standard set is easy to expand, and most of our customers do.
When building a video platform or implementing analytics in an existing platform, we can help our partners figure out what additional data might be useful. We also like to add data that helps developers trace errors. For marketing purposes or for analyzing viewer behavior, it can also be very useful to send certain metadata on the content itself.
I will share four examples of how to use video analytics:
1. Stream quality monitoring
Standard Conviva KPIs, such as rebuffering ratio, startup time and bitrate tell you how well your streams are working and, consequently, how the viewer experience is. Video analytics also show you whether users are encountering problems when starting a stream (video start failures and exits before video starts) or during viewing (video playback failure).
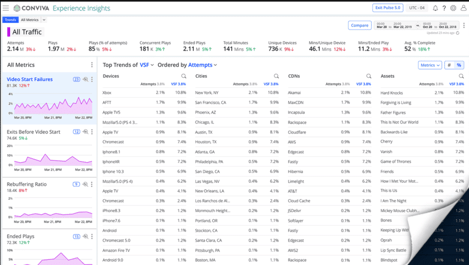 Example of a Conviva Dashboard
2. Troubleshooting
When combing through video analytics we are always looking for values that stand out and need further investigation. Deviations in historical data and averages could indicate performance problems and even point you towards a possible cause. Updates in vendor tooling, updates of operating systems, updates of the application itself and changes in network traffic can all cause disturbances. Or, for example, as we recently saw with one of our partners, issues with one particular network provider. Analyzing video analytics helps you detect and resolve these issues.
3. Discovering trends in viewing behavior
Another one of the great powers of video analytics is the ability to discover trends. Statistics on viewing time, content, devices and platforms used. This helps you set priorities for further development of your video apps.
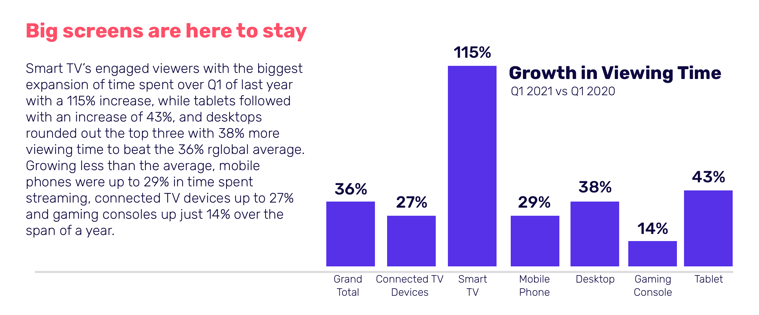 Device trends stated in Conviva's state of streaming 2020 research
4. Comparing yourself to the competition
Because the Conviva platform is used worldwide, it has a lot of data. You can use this data to benchmark your own performance against other providers. Such a benchmark report once gave us a great insight when we saw that a partner’s live streams on Chromecast were being outperformed by the competition. We investigated, and found that this was due to a memory shortage. By simplifying the appearance of the player and limiting the rewinding of the stream under certain circumstances, the problem was solved.
So much data, so little time
With so much data available, you need powerful analysis tools. Using Conviva's standard filters, or filters you add yourself, you can find what is relevant to you. When looking for the origin of a video quality issue, for example, you can isolate different types of streams and devices to find the problem.
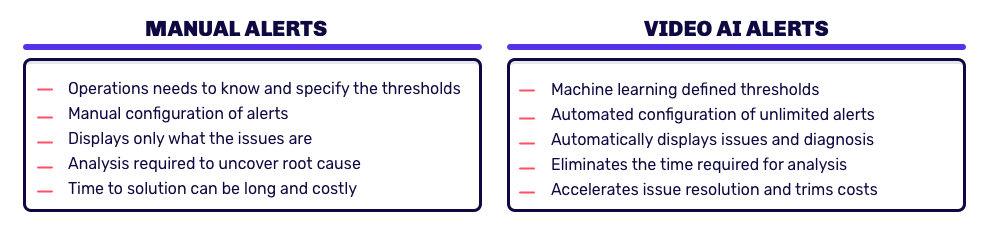
But even with good filtering, it is too much work to detect all errors yourself and trace them manually. That is why Conviva automates many analyses with video alerts. The simplest type of alert, the manual alert, is an email alert that is sent when a certain metric exceeds a preset value. This works well if you have a good idea of what that threshold should be and what should be done when an alert occurs. If you don't, you might set thresholds too high or too low and, consequently, get too few or too many alerts. When dealing with alerts manually, finding the cause of the alert can take a lot of time.
That's where Conviva’s intelligent “Video AI Alerts” come in. The platform uses machine learning to determine what the alert threshold should be and also comes up with its own diagnosis for each alert. Not only are alerts much more useful this way, you also save time, since they are automatically configured.
No Conviva? No problem.
We like working with Conviva, but at the end of the day it’s just one of the available tools for video analytics. We always work with the tools our clients choose, and there are many more options besides Conviva. Heart of the matter is that you find a way to see what your users are seeing and use those insights to improve their experience. And your own results.